In this month’s message I would like to discuss kW demand and energy. I covered this topic in previous newsletters, but now you should be seeing graphs on your bill statements showing monthly usage and kW demand, so I wanted to review these topics.
Energy and demand are two separate things. Energy is the amount of power you consume; it is the amount of electricity used over a period of time and you would see it on your bill as a kWh or kilowatt- hour. Demand measures the maximum amount of electrical power consumed at a given time.
How is demand calculated? Your meter monitors demand over a 15-minute time frame and records the highest 15-minute average that occurs each month.
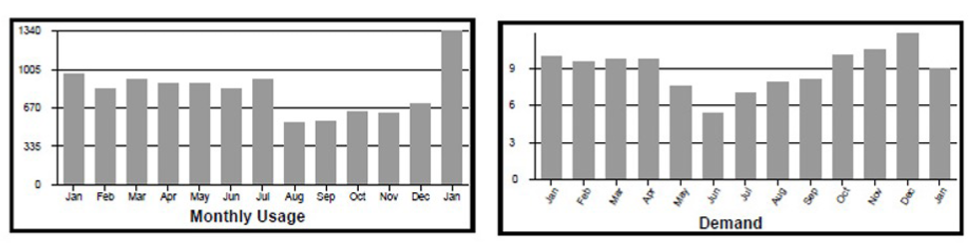
Demand is reset at the end of every billing cycle and the meter starts over for the next billing period. The demand line item on your monthly bill represents the 15-minute interval with the highest amount of electricity, measured in kilowatts (kW), used during the billing month. You should see two graphs on your bill statement similar to the ones shown below. These charts give you some insight into how you consume electricity.
- The Monthly Usage Chart shows the kWh usage for the past 12 months.
- The Demand Usage Chart refers to the maximum amount of electrical power being consumed at a given 15-minute period for the month as opposed to energy, which is the amount of power consumed over the monthly billing period.